
AT the end of March 2021, the S&P 500 is up 6% for the year and the quarter whereas the Nasdaq 100 is up less than 2%. Small and Mid Caps have greatly outperformed Big Caps: +18.2% and +13.4% respectively vs 6% for the SPY. With inflation expectations moving quickly higher and above the Fed […]
U.S. Stocks: bad seasonality coming?
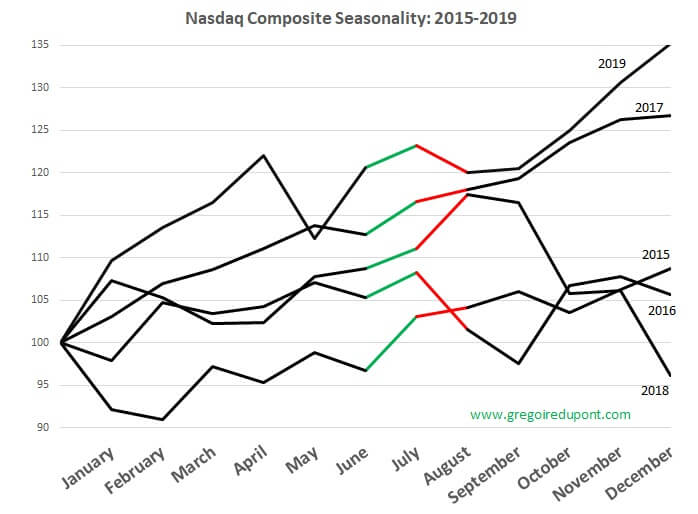
At the start of July, I came across a chart similar to the one below: What is it telling us? Five years might not be enough statistically but at least the Nasdaq Composite has been pretty strong in July (green line period) and then pretty weak in August (red line period) and in […]
H1 2020 Snapshot: Winners Take All!
AT the end of June 2020, the S&P 500 is down 4.2% for the year whereas the Nasdaq is up by more than 16%. After a very weak Q1, U.S. Equity Markets recovered in Q2 with the Nasdaq massively outperforming any other market. Social Media, Online Retail, Cloud Computing, Software… have greatly contributed to that […]
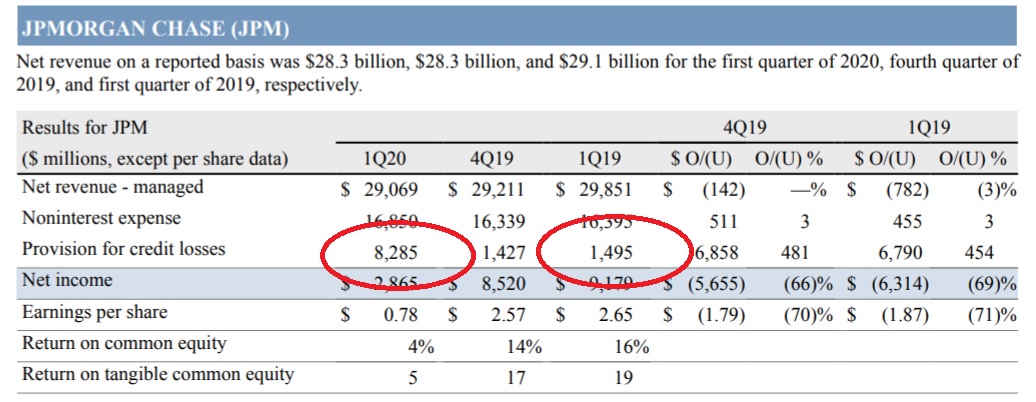
Banks… hmm…
Since the coronavirus breakout and the following lockdowns, there is no doubt that Banks have been massively hit. But there might be more to come. First, with the deterioration of the economy, many Banks will have to build more reserves for credit losses. As JP Morgan underlined during its latest earnings, “provisions for credit losses […]
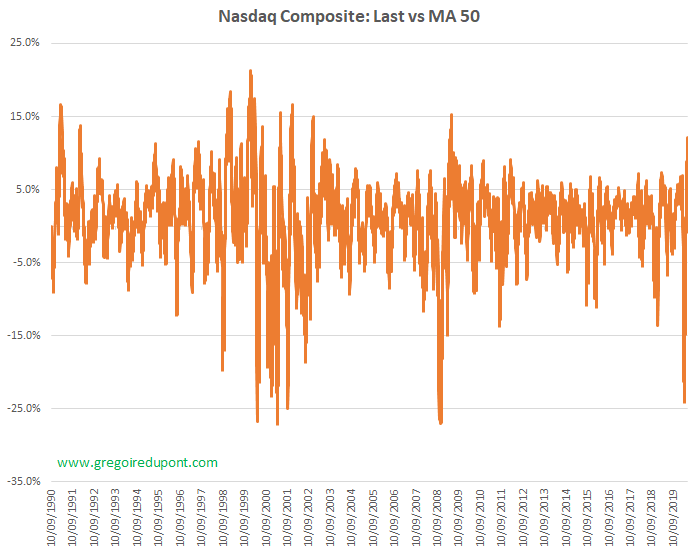
Stocks: from one extreme to another.
The Stock Market has been on a tear since the lows on the 23/03/2020. What happened on the same day? The Fed announced QE Infinity. Simple coincidence? I guess not. Technology companies have been outperforming the market with some big moves across the Technology Sector. The Nasdaq Composite is up 1.7% for 2020 and is […]

Black Swan FX Trade
Recently, the Oil Market has experienced a Black Swan Moment: collapsing demand, contango issues, storage scarcity, technical forced sellers, ETF dislocation ($USO)… All of this translated into this infamous move with negative pricess. To be perfectly clear, it was mainly driven by technical factors on contract expiring and forced sellers as storage was […]
Before the open II
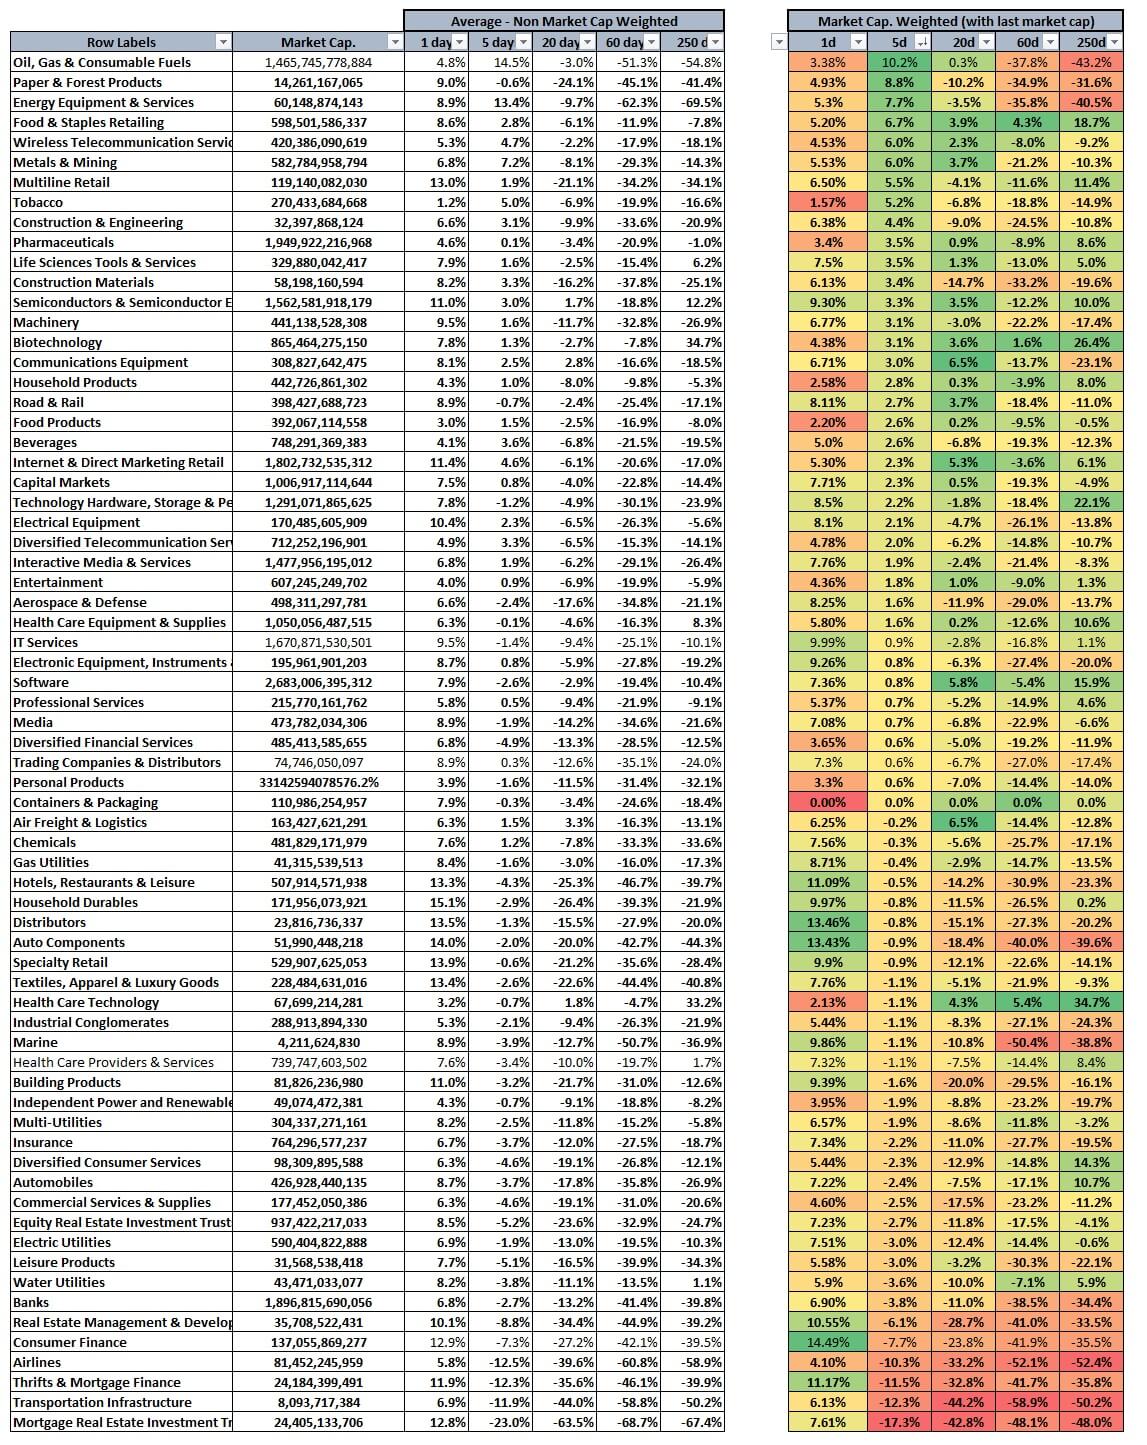
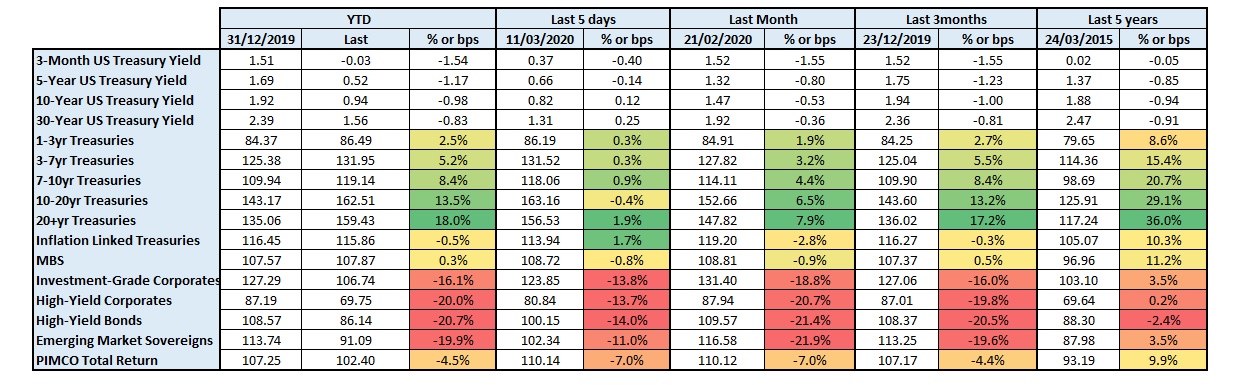
2/3 weeks ago I did a post on the different performances across asset classes and sectors in the middle of the coronavirus / lockdown crisis. Yesterday the S&P 500 Futures broke the 2635 level on the upside. We have resistance around 2730-2750 and bigger ones at 2800-2815. I always like to know what is moving […]

“Chart Porn”
Five weeks into Financial Dislocation. Below are charts showing the extend of what is happening, but there are many more with some more relevant than others. Feel free to add yours in the Comments Section. In no particular order: Initial Claims. Source Fred. Fed Balance Sheet – Fred. Volatility Index – Vix […]
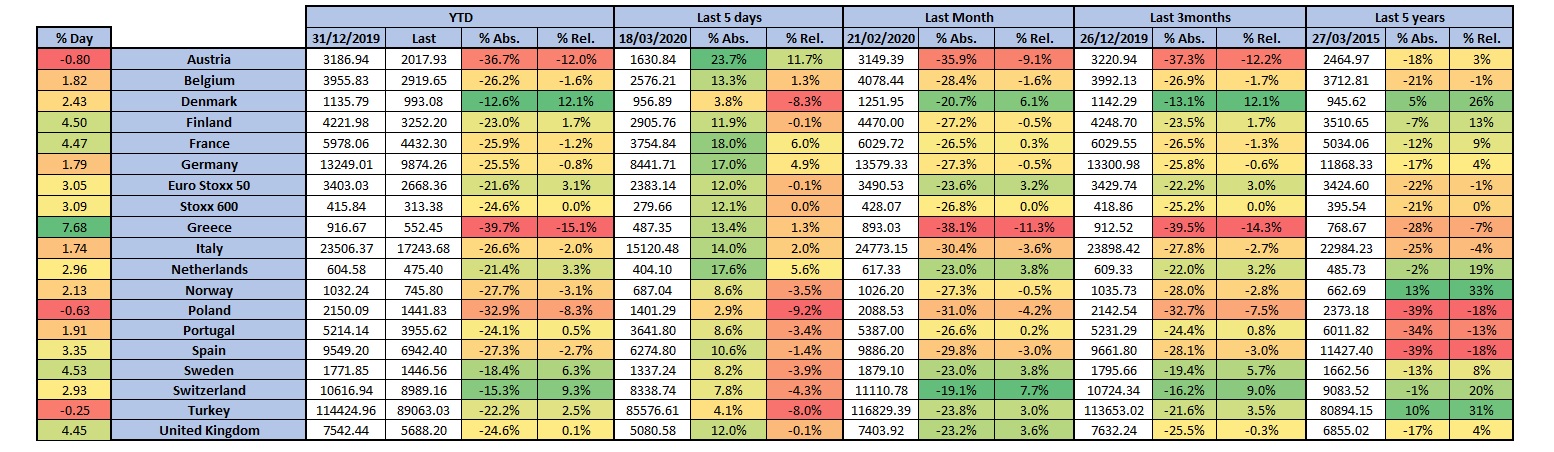
European Trading Opportunities.
Last couple of blogs, I mainly focused on Price Action across Asset Classes and U.S. Stocks Sectors. In this post, I would like to share some of the recent data for the European Equity Market. After and during a sell-off, we could identify dispersion between countries, assets and stocks among one sector. Like with the […]
Before the open
Like I did last week before the open on Friday the 13th of March, let me share price actions we had recently. On the week, the S&P 500 is down -15%. Let see how the market might reset after the OpEx (Option Expiry) for delta, gamma… and react to the several announcements made by Central […]