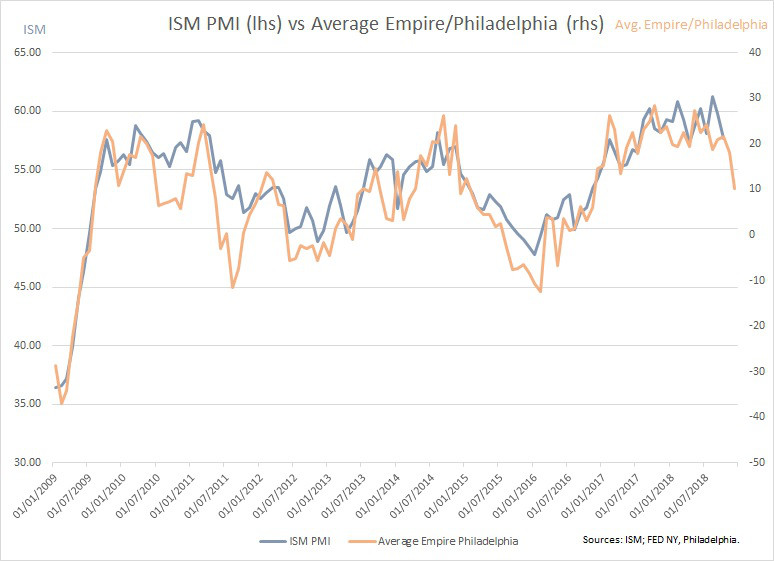
With many leading indicators showing global slowdown recently, all eyes are now on the next U.S. Economic data. So far, the U.S. ISM Manufacturing has been holding very well, at historical high levels. Nonetheless, surveys of business conditions from regional Fed recorded big drop in December. Looking at the historical correlations between those regional Fed […]
Yes, Volatility is back! (update)
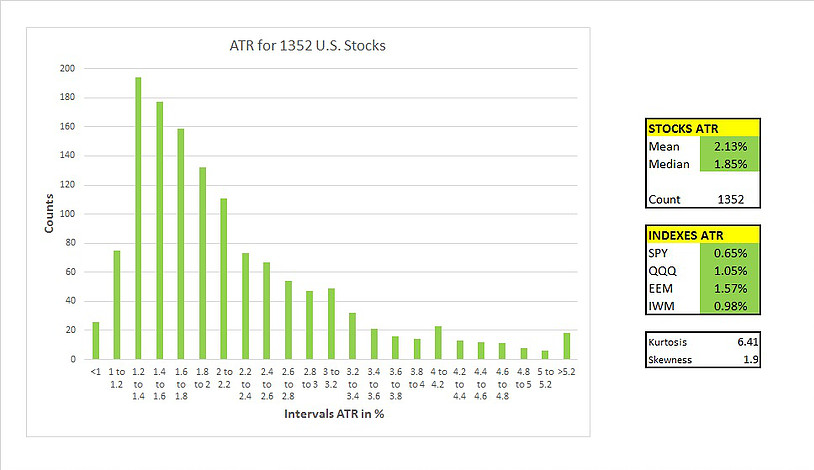
Just a quick follow up on a blog I did 2 months ago when the volatility just started to kick in. Same here with an update of my U.S. Stock Universe and how the Average True Range (ATR) behaved recently. ATRs – 13/09/2018 / VIX = 12.37: ATRs – 26/10/2018 / VIX = 18.90: ATRs […]

L’Arroseur Arrosé?
Italy has been recently under the radar for its 2019 budget. Since May 2018, Italian sovereign debt is experiencing selling pressure with the BTP (Italy) – Bund (Germany) spread up 160 basis points and trading now around 300 bps. What about France after the recent social events and Macron’ latest announcements? In 2012, the European […]
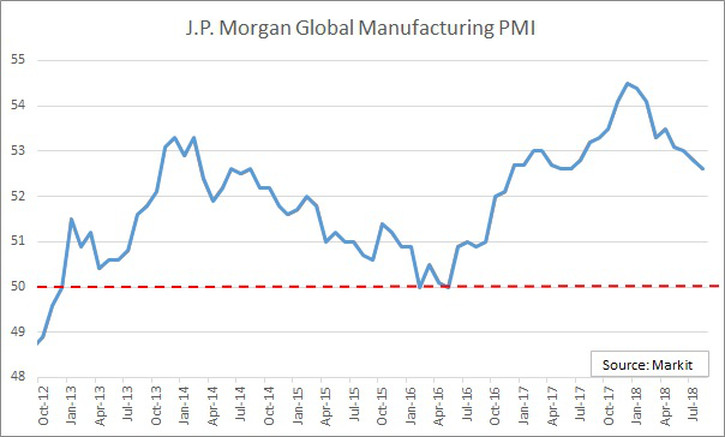
Manufacturing PMIs
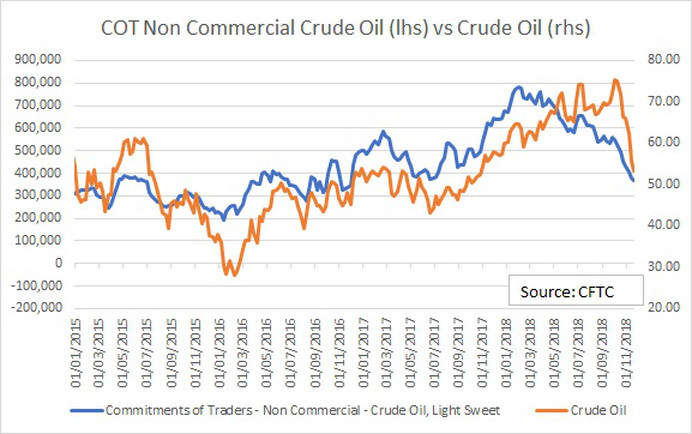
Cruel Oil
-30% in less than 2 months… after the 2014-2016 oil rout, that brings back painful memories for the sector. In 2018, Oil has been making the headlines from Trump pushing for lower prices, to Iran sanctions, or Saudi Arabia, or OPEC… All eyes are now on the OPEC Meeting in Vienna on the 6th of […]
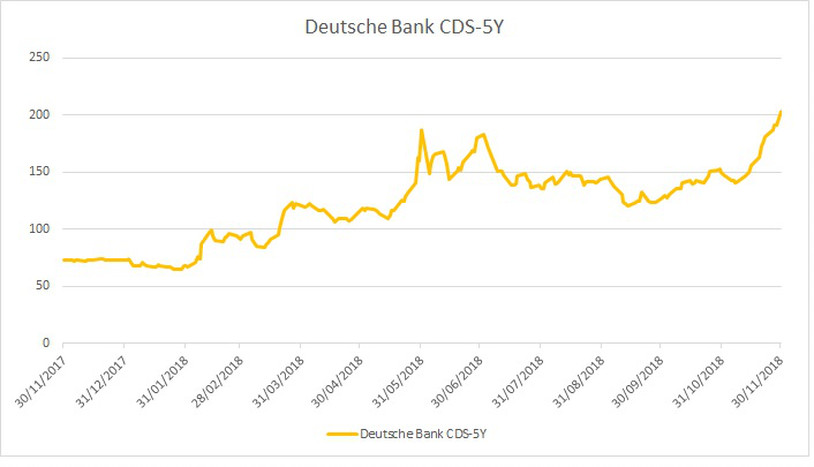
Deutsche Bank
Deutsche Bank in 4 graphs: DBK 5y CDS DBK CoCo DBK vs SX7P (Stoxx 600 Banks) DBK Monthly Logarithmic I hope it helps, Gregoire
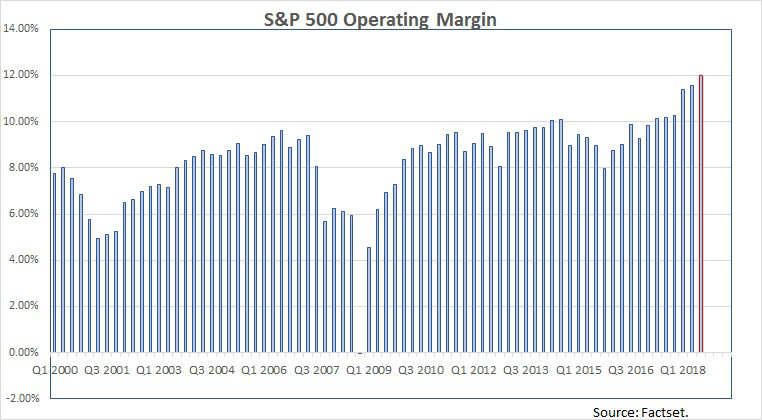
Time for a Pay Rise?
Important Disclaimer: we look at a possible pay rise for U.S. workers in 2019. For any non U.S. reader, please wait a bit before asking for one… As we are already in November, what really matters for the market is top line and bottom line growths for companies in 2019. First, let’s look at recent […]
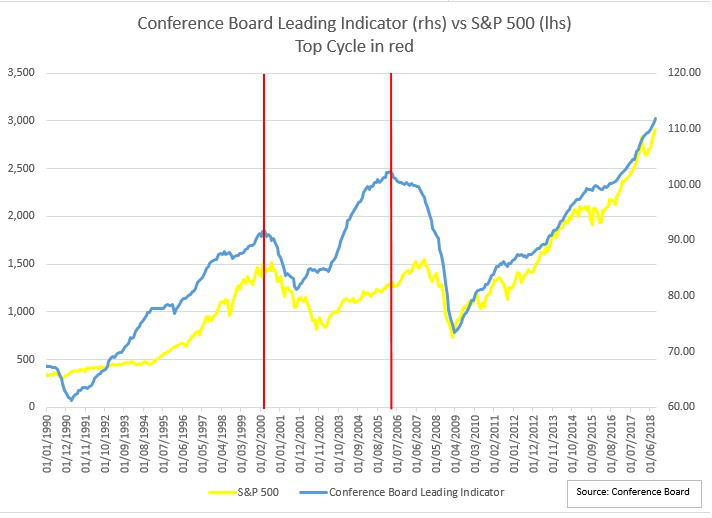
Peak or no Peak?
With more than 9 years into the U.S. economic cycle, it is fair to look at the possibility of the end of it. This question has been floating around for quite some time as this cycle is quite extended versus historical data. For example, different indicators were already flashing orange in 2015. The recent correction […]
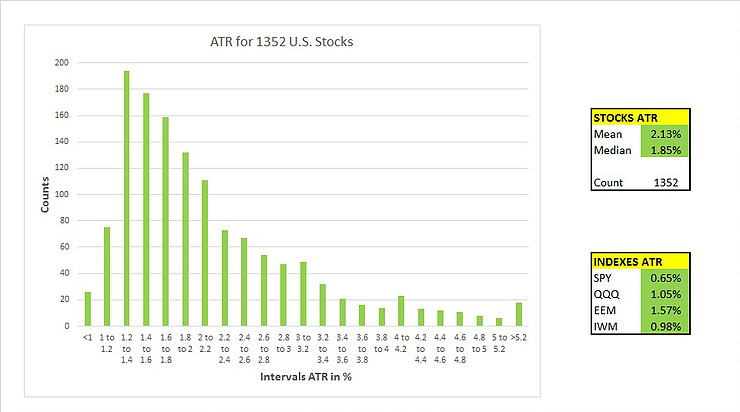
Yes, Volatility is back!
After 2 years of low volatility (cf. blog: VIX at 24 and so what?), market is now… different. To apprehend and visualize this spike in recent volatility, the Average True Range (ATR) can be very helpful. 6 weeks ago, I looked at the daily ATR for more than 1,300 U.S. stocks: https://twitter.com/GregoireDup/status/1040190100070494209 I did the […]
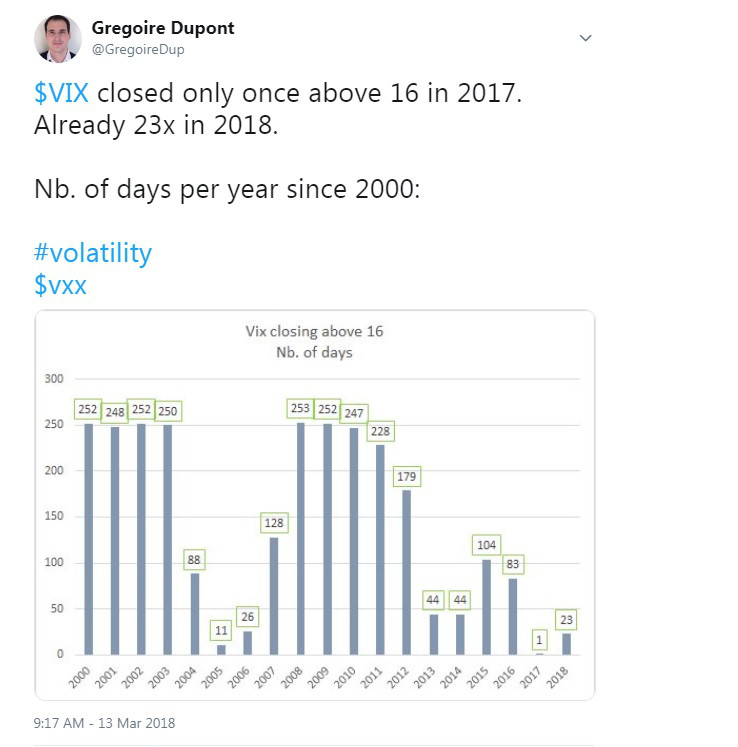
VIX at 24 and so what?
Back in March, I tweeted about the VIX and the number of days it was above 16 year to date. What is the VIX? The VIX represents one standard deviation of the market’s estimation of changes in the price of the S&P500 during the next 30 days. Why did I choose 16 on the VIX? […]